The Profit Margin: September 6, 2022
Statistic of the Week
Domestic equities are down just under 20% from their highs last November despite being up about 9% from their lows in June of this year. They have lost about $1.6 trillion in cumulative value from peak levels. Yet, they gained $2 trillion back so far in the third quarter of 2022. Since the pandemic lows of March 2020, equity markets are still up north of 75% with additional value of about $17.1 trillion on a combined basis.
Global Perspective
The Chinese National Congress is held every five years and is a meeting where leaders are appointed, and major policies are set. Investors have been watching preparations for this national congress carefully; it is set to begin in Beijing on October 16th. It is believed that revisions to the country’s zero-Covid policy may change around or after the gathering. It is also expected that President Xi will further consolidate his power base.
Market Moving Events
Monday: US Markets Closed
Tuesday: ISM Services Index
Wednesday: Beige Book, International Trade
Thursday: Jobless Claims, Consumer Credit
Commentary
The S&P 500 retreated for the third consecutive week and all three major domestic equity averages finished the week lower. The DJIA fared the best, falling 2.99%.1 The S&P 500 dipped 3.29%.2 And the tech-heavy Nasdaq faired the worst, sinking 4.21%.3 Investors did not find sanctuary in fixed income instruments as yields rose and prices fell. The 10-year Treasury finished Friday with a yield of 3.19%, up 0.16% from the week prior.4
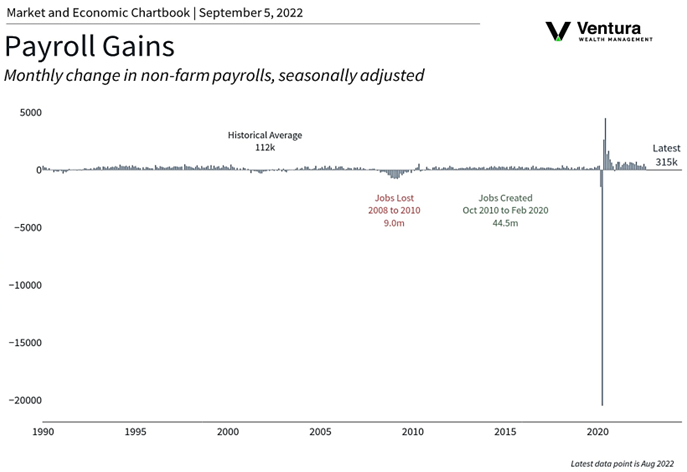
Last week was defined neither by particularly positive or negative news. Friday’s payrolls report (chart right) was the week’s most significant release; it came in more-or-less aligned with analyst expectations. While the unemployment rate rose from 3.5% to 3.7%, it did so on the back of 786,000 workers coming back to the labor market.5 Wage growth was solid at 5.2%.6 Manufacturing data was better than expected.7
Much has been written about September being a historically treacherous month for investors. Since 1896 for the Dow, and 1928 for the S&P500, indices have retreated on average 1% during the month.8 However, some analysts believe that the selloff in August may have jumpstarted this seasonal weakness. Earnings season wound down and several Federal Reserve governors (including Chair Powell) are scheduled to speak in the days ahead. With sentiment so sour currently, a positive comment could spur a snapback rally.
Chart of the Week
Sources
Statistic of the Week:
Investor’s Business Daily
Global Perspective:
CNBC.com
Market Moving Events:
MarketWatch.com
Chart of the Week:
Clearnomics, Haver,
Bureau of Labor Statistics
Commentary: 1.Bloomberg 2.Bloomberg 3.Bloomberg 4.Bloomberg 5. Investor’s Business Daily 6. Investor’s Business Daily 7. Investor’s Business Daily 8. Barron’s