The Profit Margin: September 3, 2024
Statistic of the Week
Raising kids is expensive – no surprise there. A recent study by Creditnews Research examined the 100 most populous metro areas to determine which cities were the most expensive areas to raise children. The top five most expensive areas are: San Francisco, CA, San Jose, CA, Boston, MA, Bridgeport, CT, and San Diego, CA. The average annual cost of raising a child in San Francisco is $37,340. The total cost of raising that child until they are 18… $672,120.
Global Perspective
The global trade war remains in an escalated state. The Canadian government followed the U.S. and European Union and placed a 100% tariff on the import of Chinese electric vehicles and a 25% tariff on imported steel and aluminum. The Canadian government asserts that these industries have been unfairly subsidized by the Chinese state. China has stated that these tariffs will damage trade and cooperation between the two nations.
Market Moving Events
Tuesday: Construction Spending, ISM Manufacturing
Wednesday: Beige Book, Factory Orders
Thursday: Jobless Claims, ADP Employment, ISM Services
Friday: Nonfarm Payrolls
Commentary
Domestic equity markets were mixed last week. While both the DJIA and S&P 500 were able to notch weekly gains, the Nasdaq retreated. The DJIA was the week’s leader, rallying 0.94%.1 It hit a fresh high on Friday and is now on a three-week winning streak.2 The S&P 500 closed the week up 0.24%.3 And the Nasdaq fell, but has remained above a critical level. All eyes were on Nvidia’s earnings. While results were solid, they were not strong enough to keep the Nasdaq moving in the right direction. As such, the Nasdaq dipped 0.92%.4 Fixed income yields moved slightly higher on the week. The 10-year Treasury yield moved up 0.09% to finish Friday at 3.91%.5
Investors watched the PCE Inflation Index closely last week (chart right). Matching analyst estimates, the indicator is telling a good story about the direction of inflation. Over the last three months, the core reading has registered an annualized reading of 1.7%.6 Simultaneously, consumer spending continues to look strong. The Bureau of Economic Analysis noted that the consumer spending rose at an annualized rate of 2.9% in the second quarter while revising second quarter GDP higher to an annualized rate of 3.0%.7 These are all good numbers – which leads us to a conversation about the timing and magnitude of FOMC rate cuts.
This week, we will receive the Nonfarm Payrolls report on Friday. This will be a key piece of data for the FOMC’s decision making process. The unemployment rate is expected to tick down to 4.2% from 4.3% and the economy is expected to have added 162,000 jobs.8 Serious deviation could cause volatility to reassert itself.
Chart of the Week
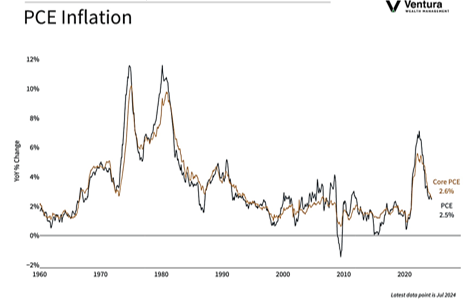
The Federal Reserve’s preferred inflation indicator, the PCE Price Index, matched analyst expectations by rising 0.2% in July. The 12-month headline inflation rate held steady at 2.5%, also in line with analyst estimates.
Source Materials
Market Moving Events:
MarketWatch.com
Chart of the Week:
Clearnomics,
Bureau of Economic Analysis
Statistic of the Week:
CNBC.com, Creditnews Research
Global Perspective:
The Economist
Commentary:
1. Bloomberg
2. Investor’s Business Daily
3. Bloomberg
4. Bloomberg
5. MarketWatch.com
6. Investor’s Business Daily
7. Barron’s
8. MarketWatch.com