The Profit Margin: May 9, 2022
Statistic of the Week
The S&P 500 is off to one of its worst starts ever. However, if history repeats itself, a recovery is in the mix. Since 1932, when the market has started off with a strong downtrend of similar magnitude, the market went on to rebound five of six instances for the balance of the year with an average return of 18.48%. The one negative instance was 1941, defined by World War II and specifically, Pearl Harbor.
Global Perspective
Despite international sanctions, Russian oil is still making its way onto global markets. The big question is – where is it going? In the month of April, over 11.1 million barrels of Russian crude were loaded onto freighters with “destination unknown.” This should be compared to virtually none before the war began in Ukraine. It is suspected that the oil is being transferred to other freighters and mixed with legal crude while at sea.
Market Moving Events
Monday: Wholesale Inventories
Wednesday: Consumer Price Index, Federal Budget
Thursday: Jobless Claims, Producer Price Index
Friday: Import Price, Consumer Sentiment
Commentary
Last week was defined by high-volatility, the Federal Reserve announcement, and markets that ended up more or less where they started. On the week, the S&P 500 fell -0.21%, the DJIA retreated -0.25%, and the Nasdaq dipped -1.54%.1 As equities fluctuated significantly over the trading sessions, so too did fixed income yields. The 10-year Treasury finished Friday with a yield of 3.12%, up 0.23% from the week prior.2 For those keeping track, volatility in the bond market has mirrored that of the equity markets. The yield on the 10-year Treasury crossed the 3.00% mark for the first time since 2018, and the change in yields from March to April represented the largest monthly change in 17 years.3
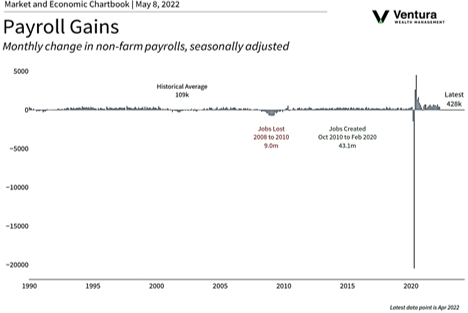
The equity markets were largely flat on the week heading into Wednesday’s FOMC meeting announcement. In line with expectations, the Fed raised target rates 0.50%.4 Sparking a massive rally, Fed Chair Powell essentially took a hike of 0.75% in June off the table.5 (This causes us to expect 0.50% hikes at the next two meetings). However, a decline in productivity followed by mixed nonfarm payrolls results for April (chart right), caused investors to sell off Wednesday’s gains on Thursday into Friday.
This week, all eyes will be on Wednesday’s Consumer Price Index and Thursday’s Producer Price Index readings. There is a fair amount of debate as to whether we are experiencing peak inflation. While headline numbers are still running hot, undercurrents suggest we may indeed be at peak. That could be welcome good news. Expect further volatility.
Chart of the Week
Sources
Statistic of the Week:
CNBC.com, Bank of America
Global Perspective:
Business Insider,
The Wall Street Journal
Market Moving Events:
MarketWatch.com
Chart of the Week:
Haver, Clearnomics,
Bureau of Labor Statistics
Commentary: 1.Bloomberg 2.Bloomberg 3. Barron’s, Investor’s Business Daily 4. Investor’s Business Daily 5. Investor’s Business Daily