The Profit Margin: May 31, 2022
Statistic of the Week
Natural gas prices jumped above $9 per million BTU last week. The commodity’s price hit the highest level in over a decade. Prices moved about 30% higher in May and have now seen three consecutive monthly gains of 20%+. The war in Ukraine has been a major contributing factor as global inventories have been shrinking and supply uncertain.
Global Perspective
The Chinese central government held a massive video conference addressing multiple levels of government simultaneously. The goal of the meeting was to discuss how to shore-up the economy, which had been targeted to grow at a rate of 5.5% in 2022. (Many analysts believe this to be far too optimistic). The COVID lockdowns in Shanghai and Beijing have stifled growth and caused further global supply chain issues.
Market Moving Events
Monday: US Markets Closed
Tuesday: Consumer Confidence, Case-Shiller Home Price Index
Wednesday: ISM Manufacturing, Beige Books, Construction Spending
Thursday: Jobless Claims, Factory Orders
Friday: Nonfarm Payrolls, Unemployment Rate, ISM Services
Commentary
Investors waited… and waited… and waited for a bounce in equities. Their patience was rewarded last week as all three major US equity indices rallied significantly. The Nasdaq, which has been a year-to-date laggard put in the strongest move higher, up 6.8%.1 The S&P 500 rose 6.6%.2 And the DJIA joined in the relief rally, jumping 6.2%.3 Fixed income yields moved slightly lower on the week. The 10-year Treasury finished Friday with a yield of 2.75%, down -0.04% from the week prior.4
What caused the sizeable rally? Not much. We would argue that the trading action was mainly caused by seller exhaustion. Pessimism remains. Several vocal and generally well-respected hedge fund managers made notably negative statements last week.5 But like a pendulum, once sentiment skews the scales too far in either direction, gravity begins to pull it towards the center. That process began last week. The question is how long this current uptrend will continue.
The answer will largely depend on perceptions of Federal Reserve policy moving forward. Those looking for a more dovish stance were happy to see the Fed’s favorite inflation indicator, the PCE Deflator (chart right), come in weaker than expected while consumption picked up.6 On Friday, we will receive the Nonfarm Payrolls figure for May.7 Some cooling of the overheated job market would be welcome news for those hoping to see inflation expectations continue to creep lower.
Chart of the Week
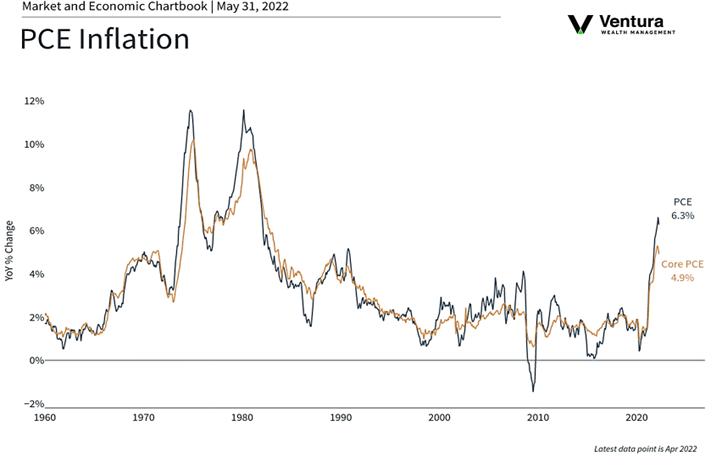
Personal Consumption Expenditures rose 0.9% in April, a 9.2% year-over-year increase. The report beat analyst expectations; the report for March was also revised higher.
Sources
Statistic of the Week:
CNBC.com, Bankrate
Global Perspective:
CNBC.com
Market Moving Events:
MarketWatch.com
Chart of the Week:
Haver, Bureau of Economic Analysis
Commentary: 1.Bloomberg 2.Bloomberg 3.Bloomberg 4.Bloomberg 5. Barron’s 6.Bloomberg Investor’s Business Daily