The Profit Margin: June 30, 2025
Statistic of the Week
Although the number of people filing for initial unemployment claims decreased last week compared to the previous week, individuals currently unemployed are struggling to secure new positions. Continuing claims have hit their highest level in 3.5 years, with around 1.97 million individuals receiving benefits after their initial unemployment check for the week ending June 14. Economists now anticipate a slight increase in the unemployment rate, rising from 4.2% to 4.3% for June.
Global Perspective
The oil markets experienced significant volatility last week. Brent crude prices surged to a peak of $81 per barrel, marking the highest level in five months. However, following Iran’s announcement that it would not blockade the Strait of Hormuz, prices swiftly declined to below $68 per barrel.
Market Moving Events
Tuesday: Construction Spending, Job Openings, ISM Manufacturing, Auto Sales
Wednesday: ADP Employment
Thursday: Jobless Claims, Nonfarm Payrolls, Tade Deficit, Factory Orders, ISM Services, U.S. Markets and VWM Offices Close at 1PM EST
Friday: U.S. Markets and VWM Offices Closed
Commentary
Despite geopolitical events at the start of the week, both equity and fixed income markets rallied last week. All three major domestic equity indices finished the week significantly higher, taking year-to-date performance from slightly negative / slightly positive into “firmly in the black” territory. The Nasdaq was the best performer of the week; it rallied 4.25%.1 The DJIA jumped 3.82%.2 And the S&P 500 increased 3.44%.3 Fixed income yields fell on the week. The yield on the 10-year Treasury dropped 0.10% to finish Friday with a yield of 4.29%.4
While the S&P 500 and the Nasdaq finished the week with record closes,5 it is important for investors to remember that the trade war is not over and can still cause an uptick in volatility in the investment markets. On Friday, markets retreated from their highs when President Trump announced he was ending trade negotiations with Canada after the Canadians imposed a digital services tax that would impact American companies.6 (Canada has since backtracked).7 Friday also saw an announcement of a deal with the Chinese. However, the details are very light beyond the announcement that China would allow more rare earth elements and high-end magnets to flow to the U.S.8 The July 9th deadline for the 90-day pause looms closer with each passing day. President Trump has been signaling a willingness to be flexible with the deadline – just how flexible is a question mark.
This week’s trading will be abbreviated because of Independence Day. The week is full of key economic data releases. Nonfarm Payrolls on Thursday will be watched closely.
Chart of the Week
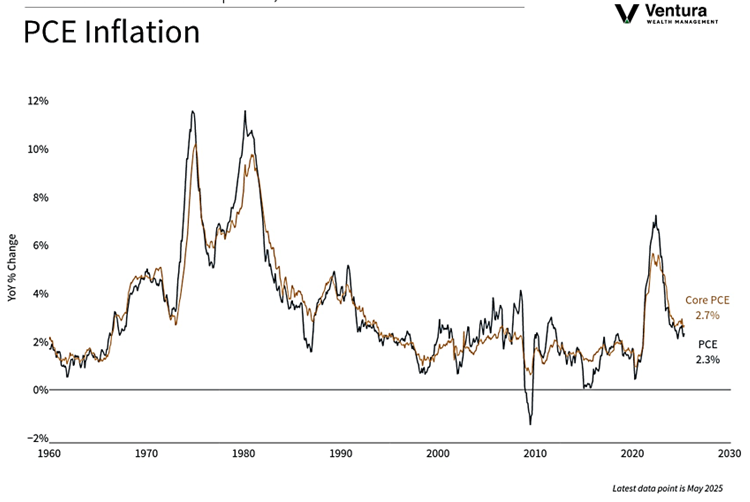
The PCE Price Index report was in line with analyst expectations in May, showing year-over-year inflation at 2.3%. However, the core reading, which is the Federal Reserve’s preferred inflation gauge, rose more-than-expected during the month. It shows annual inflation at 2.7%.
Source Materials
Market Moving Events:
MarketWatch.com
Chart of the Week:
Clearnomics,
Bureau of Economic Analysis, CNBC.com
Statistic of the Week:
Yahoo! Finance, Department of Labor
Global Perspective:
The Economist
Commentary:
1. Bloomberg
2.Bloomberg
3. Bloomberg
4. MarketWatch.com
5. Bloomberg
6. Investor’s Business Daily
7. Reuter’s
8. The Associated Press