The Profit Margin: July 7, 2025
Statistic of the Week
In the last six months, the value of the U.S. dollar has fallen by over 10% against major trading partners. The basket that the dollar is being measured against includes the euro, the British Pound, the Japanese yen, the Canadian dollar, the Swiss franc, and the Swedish krona. This marks the dollar’s poorest beginning to a year since 1973, after the dollar had fully shifted away from the gold standard.
Global Perspective
All 22 of the American banks subject to the Federal Reserve’s stress tests passed in the most recent round. As a result, several of the large financial institutions announced that they would be raising quarterly dividends – some by as much as 33%.
Market Moving Events
Tuesday: Consumer Credit
Wednesday: Wholesale Inventories, FOMC Meeting Minutes
Thursday: Jobless Claims
Friday: Federal Budget
Commentary
With domestic equity markets near all-time highs and volatility in the fixed income markets subsiding, there remains a fair amount of discussion as to the state of the labor market. Why do so many economists, analysts, portfolio managers, and investors place the labor markets under such scrutiny? Because the U.S. consumer accounts for around 70% of domestic economic activity. And when people are unsure of the future of their job, or if they have lost their job and become unemployed, they are less likely to continue spending at the rate they would when they are gainfully employed. Last week we received a number of employment statistics.
The June non-farm payrolls report showed that the economy added 147,000 jobs, significantly outpacing estimates (chart below).1 This strong figure caused a quick shift in the futures markets, where traders took the idea of a July rate cut out of play (now only at 4.7%).2 The figure was boosted by 73,000 jobs added at the state and local government level.3 The federal workforce reduced jobs by a count of 7,000.4
While investors were generally happy with the employment numbers, there were several flies in the proverbial ointment. While the U3 unemployment rate fell to 4.1%,5 the decline is attributed to workers giving up on looking for jobs. Those not looking for a job in four weeks jumped by 234,000 to 1.8 million.6 The average work week ticked lower to 34.2 hours.7 Wage growth decelerated to a 3.7% year-over-year increase.8 The underlying growth in the labor force is diminishing. While not foreshadowing “doom and gloom,” this change in condition warrants careful attention.
Chart of the Week
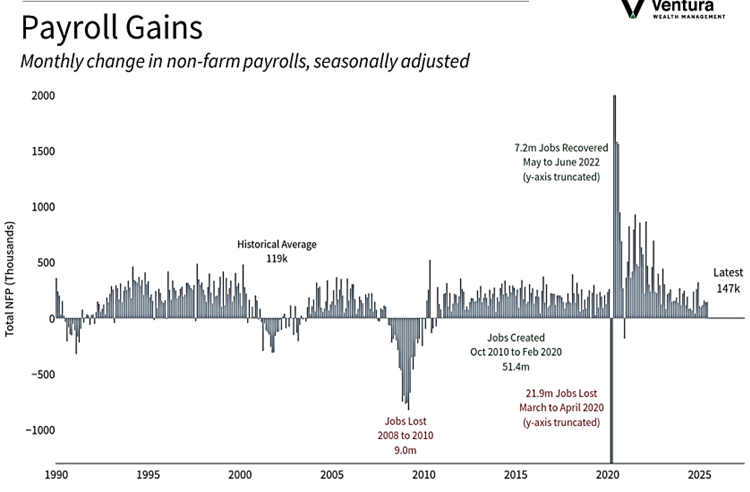
In June, the U.S. economy saw an increase of 147,000 jobs, exceeding analysts’ expectations of 110,000 jobs. Additionally, the job growth figures for April and May were revised upward. The unemployment rate fell to 4.1% as some looking for jobs gave up the search.
Source Materials
Market Moving Events:
MarketWatch.com
Chart of the Week: Clearnomics,
Bureau of Labor Statistics
Statistic of the Week:
FactSet, Eurasia Group
Global Perspective:
The Economist
Commentary:
1. Bureau of Labor Statistics
2. Barron’s
3. Barron’s
4. CNBC.com
5. Bureau of Labor Statistics
6. Bureau of Labor Statistics
7. Bureau of Labor Statistics
8. CNBC.com