
The Profit Margin: July 27, 2026
Statistic of the Week
For the first time since its 2004 IPO, Alphabet (Google) reported negative free cash flow, meaning the company spent more cash than it generated during the quarter. Free cash flow came in at negative $5.86 billion. The company also raised its 2026 capital expenditure forecast to $205 billion, with quarterly capital spending of nearly $45 billion exceeding the cash generated by operations. Investors reacted negatively to the results, sending the stock to its largest one-day decline in more than a year as concerns grew over the cost of the company’s artificial intelligence investments.
Global Perspective
President Trump threatened a new round of tariffs on several trading partners during the week. The administration proposed a 50% tariff on certain Canadian goods, citing what it described as unfair trade practices. Meanwhile, the United States and Mexico held another round of bilateral trade negotiations as the administration indicated it does not intend to extend the current USMCA trade agreement.
Market Moving Events
Tuesday: Wholesale Inventories, Consumer Confidence
Wednesday: FOMC Meeting Announcement, Fed Chair Warsh Press Conference
Thursday: Jobless Claims, Personal Income and Spending, PCE Index
Friday: Employment Cost Index, Consumer Sentiment
Commentary
The conflict with Iran and the resulting volatility in global energy markets weighed on financial markets last week. Rising oil prices pushed equities lower, while concerns over persistent inflation drove bond yields higher. All three major U.S. equity indices finished the week in negative territory. The DJIA was the relative outperformer, slipping 0.38%.1 The S&P 500 declined 0.61%,2 while the Nasdaq fell 2.13%,3 pressured by additional concerns over capital expenditures required for the artificial intelligence buildout (see the “Statistic of the Week”). Investors worried that higher energy prices could keep inflation elevated for longer, pushing the yield on the 10-year Treasury up 0.14% to 4.69% by Friday’s close.4
Markets are focused on four interrelated themes. First, developments in the conflict with Iran continue to drive energy markets. Reports that Iran’s Houthi allies attacked Saudi oil tankers in the Bab el-Mandeb Strait pushed West Texas Intermediate above $90/barrel and Brent crude above $100.5 The waterway, which links the Red Sea and Gulf of Aden, typically handles about 6% of global seaborne energy trade. Traffic through the route fell 31% last week.6 Second, the return of higher energy prices in July could reverse the expected easing in the June PCE Price Index to be released this week.7 Third, the FOMC will announce its interest rate decision and Chair Kevin Warsh will hold a press conference. While markets continue to view September as the most likely timing for the next rate hike, the possibility of action at this meeting cannot be dismissed.8 Finally, second-quarter earnings season continues, with corporate profits well above long-term trends.9
Chart of the Week
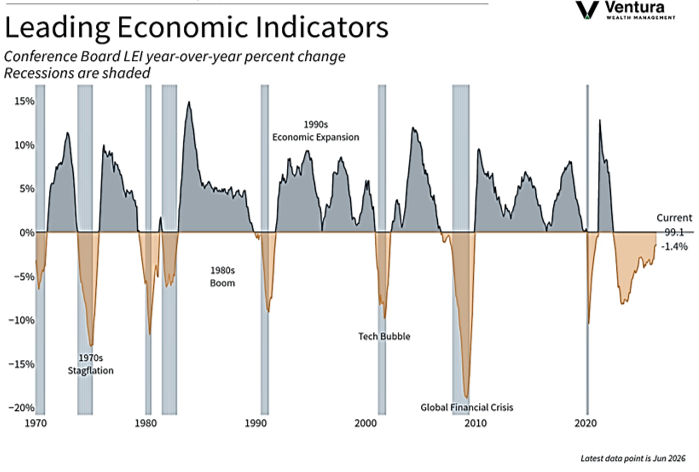
The Index of Leading Economic Indicators declined modestly in June. While the index has been an unreliable predictor of economic activity since the pandemic, the latest report did highlight weakening consumer spending, a trend investors will monitor.
Source Materials
Market Moving Events:
MarketWatch.com
Chart of the Week: Clearnomics,
Bureau of Labor Statistics
Statistic of the Week:
Yahoo! Finance
Global Perspective:
The Economist
Commentary:
1. Bloomberg
2. Bloomberg
3. Bloomberg
4. MarketWatch.com
5. Investor’s Business Daily
6. Investor’s Business Daily
7. MarketWatch.com
8. Investor’s Business Daily
9. Barron’s