The Profit Margin: January 22, 2024
Statistic of the Week
A recent study looked at people aged 65 and older and determined how much money a retiree would need beyond Social Security to retire in each state for a 25-year period. Hawaii was the most expensive state to retire in by a wide margin. Retirees there would need just over $2 million. There are 12 states where you would need to have at least $1 million to spend. The average projected spend rate nationwide over a 25-year period is $835,453. The state with the lowest spend demands: West Virginia. There, retirees are projected to spend less than $700,000 in retirement.
Global Perspective
Chinarecentlyreportedimportantfiguresontheconsumerandtheeconomy.GDPgrewatanannualizedrateof5.2%, retail sales rose 7.4%, and output grew 6.8%. The unemployment rate ticked higher to 5.1%. (Notably, they have stopped reporting “youth unemployment”). The reported figures show the world’s second-largest economy doing ok, not great.
Market Moving Events
Monday: Leading Economic Indicators
Thursday: Jobless Claims, GDP, Durable Goods Orders, New Home Sales
Friday: Personal Income and Spending, PCE Index, Pending Home Sales
Commentary
Shortened trading last week started out on the wrong foot, however positive economic data and earnings reports buoyed confidence and equity markets were able to finish the week strongly in the black. The DJIA rose 0.27%, the S&P 500 increased 1.17%, and the Nasdaq rallied 2.26%.1The DJIA and the Nasdaq were able to flip into positive territory on a year-to-date basis and the S&P 500 hitarecordlevelonFriday.2Whileequitiesrallied, bond prices fell as yields rose. The 10-year Treasury yield finished Friday at 4.13%.3The yield on the 10-year is up 0.25% since the start of the year.4
One of the more important data points released last week was Consumer Sentiment. Sentiment figures had their biggest monthly increase since 2005.5Expectations for lower inflation and improved financial conditions is helping the consumer’s resilience.6Consumer spending (chart right) reinforced the idea that the consumer merrily spent their way through the holiday shopping season. Last week’s jobless claims were at their lowest level in over a year.7Accounting for about 70% of U.S. economic activity, a strong consumer is necessary for continued expansion.
The week ahead has several key economic data releases as well as earnings reports. Fourth quarter GDP will be reported on Thursday. Analysts forecast the economy grew 1.8% in 2023.8On Friday, the PCE Index will be released. The measure is expected to show inflation continuing to moderate. Markets have been flying high. Let us hope for no negative surprises in the data ahead.
Chart of the Week
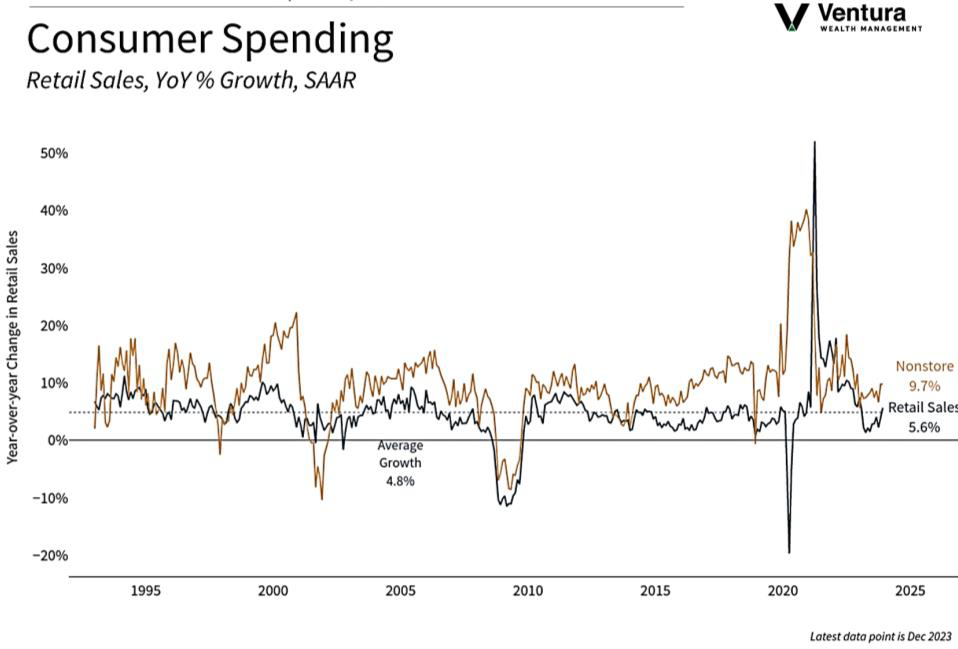
Retail sales during the holiday shopping season surpassed analyst estimates. The figure rose 0.6% in the month versus expectations of 0.4%. The 5.6%year-over-yearrise(not adjusted for inflation) demonstrates a resilient consumer.
Sources
Market Moving Events:
MarketWatch.com
Chart of the Week:
Clearnomics, Census Bureau, CNBC.com
Statistic of the Week:
CNBC.com
Global Perspective:
Reuters
Commentary:
1. Bloomberg
2. Barron’s
3. MarketWatch.com
4. MarketWatch.com
5. Barron’s
6. Barron’s
7. Investor’s Business Daily
8. Investor’s Business Daily