The Profit Margin: August 12, 2024
Statistic of the Week
What does your credit card debt situation look like? The Federal Reserve Bank of New York reported that credit card debt, in aggregate, reached a record level in the United States, totaling $1.14 trillion. The average balance has risen 4.8% year-over-year to $6,329. Over the past year, approximately 9.1% of credit card balances became delinquent.
Global Perspective
Many multinational companies have now reported two quarters of earnings for 2024. In their earnings calls, a common theme has been that slowing Chinese demand is crimping profitability. Economists note that demand is cooling due to the impact of a lackluster economy while domestic competition has simultaneously picked up. Similar results are being felt across many sectors.
Market Moving Events
Tuesday: Producer Price Index
Wednesday: Consumer Price Index
Thursday: Jobless Claims, Retail Sales, Industrial Production
Friday: Housing Starts, Builder Permits, Consumer Sentiment
Commentary
If you looked at the starting levels for the major indices on Monday, and the closing levels on Friday, you might be misled into thinking it was a tame week on Wall Street. It was anything but. While all three major averages retreated slightly, they finished well off the lows witnessed on Monday morning after an opening swoon. Monday’s action was largely driven by the sell-off begun by lackluster employment data, followed by Japan opening with its worst daily performance since the Crash of ’87.1 By Monday’s close the Nasdaq had fallen 3.4%, the S&P 500 dipped 3.0%, and the DJIA retreated 2.6%.2 Over the course of the week, the indices moved higher and volatility (chart right) receded. They finished close to unchanged from the start of trading Monday – down 0.18%, 0.04%, and 0.60%, respectively.3 Meanwhile, fixed income yields rose after hitting a 52-week low.4 The 10-year Treasury finished Friday with a yield of 3.95%, up 0.15% on the week.5
Last week was light on economic releases, but there were two data points that lifted investors’ spirits and prompted the turnaround. Initial jobless claims, which unexpectedly rose and spooked investors the week prior, dipped more than forecast.6 Then, the ISM Services Index, which measures activity in the “services” portion of the economy, regained strength.7 This week, we will receive both the Producer Price Index and Consumer Price Index readings for the month of July. With all eyes on the Fed and timing around potential rate cuts, these reports will be monitored closely. It is important to remember that when we have a volatility spike, as we did last week, it is not uncommon to have aftershocks.
Chart of the Week
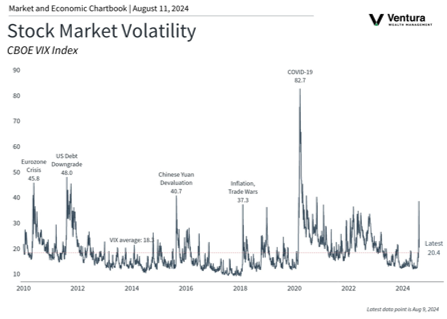
The uptick in volatility in the investment markets has been mirrored by a surge in the CBOE VIX Index, or “Fear Index.” The index had its biggest jump since the start of COVID on Monday and gradually fell as the week progressed. Friday’s closing reading of 20.4 is slightly elevated.
Source Materials
Market Moving Events:
MarketWatch.com
Chart of the Week:
Clearnomics,
CBOE
Statistic of the Week:
CNBC.com
Global Perspective:
Financial Times
Commentary:
1.CNBC
2.Bloomberg
3.Bloomberg
4. Investor’s Business Daily
5.MarketWatch.com
6. Investor’s Business Daily
7. Investor’s Business Daily
8. Bureau of Labor Statistics