
The Profit Margin: August 10, 2026
Statistic of the Week
Last year, America’s largest technology companies spent approximately $450 billion on infrastructure, much of it related to the artificial intelligence buildout. This year, spending is on track to reach $900 billion, with projections approaching $1.4 trillion next year – and many believe those estimates are conservative. These figures represent capital expenditures alone. As a percentage of GDP, the AI capex boom is quickly becoming one of the largest investment surges in U.S. history, outpacing canal and railway mania periods, the Roaring 20’s, and the Dotcom Boom.
Global Perspective
For the first time since 1998, the U.S. Treasury intervened to support the Japanese yen. The currency had fallen to a 40-year low of approximately 164 yen per U.S. dollar. Following the intervention, which was carried out through the Federal Reserve Bank of New York, the yen strengthened to approximately 155 per dollar.
Market Moving Events
Tuesday: Existing Home Sales
Wednesday: CPI
Thursday: Jobless Claims, PPI
Friday: Retail Sales, Consumer Sentiment
Commentary
Domestic equity markets surged last week on hopes for a resolution to the conflict with Iran, continued strength in corporate earnings, and a “bad-news-is-good-news” employment report. All three major U.S. averages finished the week in the black. The Nasdaq led the pack, rallying 5.19%, followed by the S&P 500, which rose 3.58%, and the DJIA, which gained 2.96%.1 Both the Dow and S&P 500 reached record highs during the week.2 Fixed income yields moved lower, with the 10-year Treasury yield falling 0.09% to close Friday at 4.65%.3 Oil prices also declined for the second consecutive week, helping to ease some inflation concerns.4
Corporate earnings continue to surprise to the upside. This earnings season, 86% of companies have beaten estimates, compared with the long-term average of 78%.5 Earnings growth has been so strong that the closely watched price-to-earnings (P/E) multiple has actually declined year to date, even as equity prices have moved higher.6
The July payrolls report highlighted underlying weakness in the labor market despite a relatively low headline unemployment rate (chart right). While the U-3 unemployment rate fell to 4.1%,7 prior payroll reports were revised lower by a combined 103,000 jobs,8 and the economy has added an average of just 21,000 jobs per month over the past three months.9 Wage growth also appears to be losing ground to inflation, while the labor force participation rate has fallen to a five-year low.10 These lackluster figures will factor into the Fed’s next policy decision, with this week’s CPI and PPI reports providing additional insight into the path of interest rates.
Chart of the Week
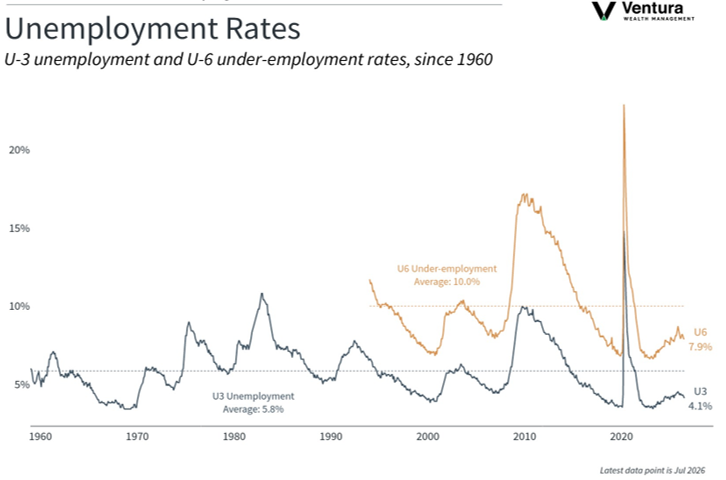
Despite a weaker-than-expected nonfarm payrolls report, the headline U-3 unemployment rate declined in July, falling from 4.2% to 4.1% as workers left the labor force.
Source Materials
Market Moving Events:
MarketWatch.com
Chart of the Week:
Clearnomics,
Bureau of Labor Statistics
Statistic of the Week:
The Economist
Global Perspective:
The Economist
Commentary:
1. Bloomberg
2. Investor’s Business Daily
3. MarketWatch.com
4. Investor’s Business Daily
5. Barron’s
6. Barron’s
7. Bureau of Labor Statistics
8. Investor’s Business Daily
9. MarketWarch.com
10. Investor’s Business Daily