The Profit Margin: April 28, 2025
Statistic of the Week
In 1982, the wealth held by the top 0.00001% (yes, that is correct) accounted for 0.1% of the nation’s total wealth. By 2023, this percentage had increased to 1.2%. In 2024, it surged to 1.8%, equivalent to $2.6 trillion, marking the largest recorded annual increase. The 19 households within this group boast an average net worth of $45 billion. The robust bull market in 2023 and 2024 contributed significantly to the rise in these net worth figures. By the end of 2024, the total household wealth in the U.S. reached approximately $148 trillion.
Global Perspective
The International Monetary Fund (IMF) has downgraded its global growth predictions for 2025. Initially, the organization anticipated a growth rate of 3.3% for the global economy, but the new forecast indicates an increase of only 2.8%. The IMF attributes this revision to the “rapid escalation of trade tensions and exceptionally high levels of policy uncertainty.” They also acknowledged that, due to the dynamic nature of the situation, estimates are expected to be revised again.
Market Moving Events
Tuesday: Consumer Confidence
Wednesday: ADP Employment, GDP, PCE, Pending Home Sales
Thursday: Jobless Claims, ISM Manufacturing, Construction Spending
Friday: Nonfarm Payrolls, Factory Orders
Commentary
Last week, the domestic equity markets continued their recovery rally, with all three major indices closing the week on a high note. The Nasdaq led the pack, surging 6.73%.1 However, it remains down 9.98% for the year, making it the poorest performer among the major averages.2 The S&P 500 experienced a weekly increase of 4.59% but has seen a decline of 6.06% year-to-date.3 Meanwhile, the DJIA gained 2.48% over the week and stands as the best performer for the year, down 5.71%.4 Bond prices also rose on the week as yields fell. The 10-year Treasury finished Friday with a yield of 4.24%, down 0.09% from the week prior.5
Last week’s rally was primarily driven by statements from the Trump administration indicating progress on multiple trade agreements. Currently, the market is exhibiting a patient demeanor. However, it is uncertain how long this patience will endure before investors start seeking tangible outcomes on the numerous deals critical for maintaining supply chains and controlling inflation. As previously noted, “soft data” hinting at a slowdown in economic activity has yet to be corroborated by “hard data.” Consumer Sentiment (chart below) serves as a “soft data” example. This week, key earnings reports alongside several significant economic indicators will be released. Amazon is set to release its first-quarter earnings, and as a key importer from China and a leading retailer, its insights will be closely monitored. Additionally, the first-quarter GDP figures will be released, with expectations indicating a cooling in economic growth to approximately 0.4%.6 We will also receive the jobs report for April and the PCE inflation index. We expect ongoing volatility.
Chart of the Week
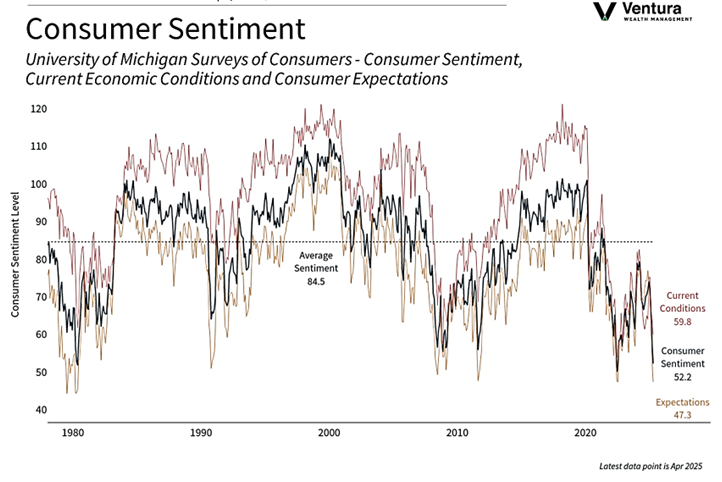
Consumer sentiment experienced a significant drop in April, marking the largest three-month decline since 1990. When analyzed by political affiliation, the results showed sentiment for Democrats and independents is at the lowest sentiment levels on record. Additionally, the University of Michigan survey indicated a notable increase in inflation expectations over the next 12-month period.
Source Materials
Market Moving Events:
MarketWatch.com
Chart of the Week:
Clearnomics,
University of Michigan, The Wall Street Journal
Statistic of the Week:
The Wall Street Journal
Global Perspective:
The Economist Investor’s Business Daily
Commentary:
1. Bloomberg
2. Bloomberg
3. Bloomberg
4. Bloomberg
5. MarketWatch.com
6. MarketWatch.com