The Profit Margin: May 16, 2022
Statistic of the Week
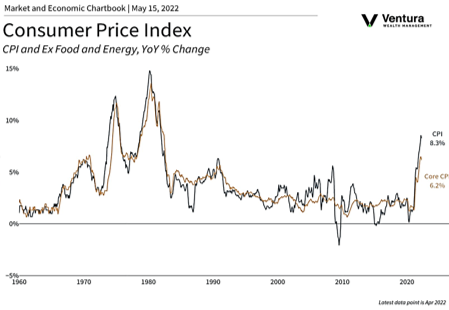
Your personal inflation rate may be different than the headline rate in the CPI (see the Chart of the Week). Some goods have shown remarkable little year-over-year inflation. IT services are down -0.9% as are toys, dipping -0.3%. Prescription drugs and college tuition are relatively tame increasing 1.7% and 2.1%, respectively. Meanwhile gasoline (43.6%), airfare (33.3%), used vehicles (22.7%), and hotel rooms (19.37%) have all shot higher.
Global Perspective
Daily reported COVID cases in Shanghai have fallen from over 25,000 in the middle of April to around 3,000 cases in mid-May. However, Chinese officials have been tightening restrictions, not loosening them, as some may suspect. Authorities have been painting a better picture than reality, and there has been an uptick in dissent against the government as the new restrictions have come without any official explanation.
Market Moving Events
Monday: Empire State Manufacturing
Tuesday: Retail Sales, Industrial Production, NAHB Home Builder’s Index
Wednesday: Building Permits, Housing Starts
Thursday: Jobless Claims, Existing Home Sales
Commentary
Global investment markets were gripped by volatility last week. While all three major US equity averages ended the week in the red, they finished well off their respective lows. The DJIA was the best performer of the three, falling -2.14%.1 The S&P 500 dropped -2.41%.2 And the already battered Nasdaq faired the worst, again, dipping -2.80%.3 (In the middle of the week, the Nasdaq had been down as much as -8.5% on a weekly basis).4 In a reversal of trend, Treasury yields fell on the week after hitting a 3-year high mid-week of 3.17%.5 The 10-year Treasury finished Friday with a yield of 2.93%, down -0.19% from the week prior.6
Mixed inflation data was a major driver of the volatility. The CPI (chart right) and PPI reports showed inflation off “peak” levels, but nevertheless elevated. In short, inflation appears to be starting the cooling process, but not as quickly as anyone would like. The S&P 500 dropped as much as 19.6% from its peak value before a strong rally Friday.7 There have been 15 S&P 500 declines of 19% since 1957.8 Five resulted in bottoms where the markets turned to log average gains of 23% over the following year.9 8 were followed by recession, and 5 were followed by further index declines.10 It’s too soon to tell if the economy will head into recession; but at this juncture, a recession is not present in the data we are studying.
The week ahead will be dominated by earnings from retailers and the official retail sales report. We expect to see the theme of consumers shifting spending from goods to services as the reports are released. There will also be a spate of housing data which will test the resilience of homebuyers amidst higher mortgage rates.
Chart of the Week
Sources
Statistic of the Week:
Yahoo! Finance
Global Perspective:
The Economist
Market Moving Events:
MarketWatch.com
Chart of the Week:
Haver, Clearnomics,
Bureau of Labor Statistics
Commentary: 1.Bloomberg 2.Bloomberg 3.Bloomberg 4. Investor’s Business Daily 5. Investor’s Business Daily 6. Bloomberg 7. Barron’s 8. Barron’s 9. Barron’s 10. Barron’s