The Profit Margin: October 17, 2022
Statistic of the Week
The Social Security Administration announced cost of living adjustments for Social Security recipients, and the increases are notable. The headline increase is 8.7%. The monthly 2023 increase in benefits amounts to approximately $146 for individual retired workers, $238 for a retired couple, $119 for a disabled worker, and $282 for a recipient with children receiving a survivorship benefit.
Global Perspective
India is one of the world’s largest greenhouse gas emitters, and the nation is trying to create a more sustainable future through various investment programs. These programs will require about $1 trillion in “climate finance” by the end of the 2020’s. The top three focus areas are sustainable food, requiring about $280 billion, renewable energy, which would need approximately $200 billion, and waste and water management at $190 billion.
Market Moving Events
Monday: Empire State Manufacturing
Tuesday: Industrial Production, NAHB Home Builder’s Index
Wednesday: Beige Book, Building Permits, Housing Starts
Thursday: Jobless Claims, Existing Home Sales, Leading Economic Indicators, Philadelphia Fed Manufacturing Index
Commentary
Volatility was felt in full-force as investors grappled with Federal Reserve comments, corporate earnings, and a slew of economic data. Domestic equity averages finished the week mixed after having a huge up day on Thursday only to see many of those gains reverse on Friday. The DJIA was able to finish the week in the black, buoyed by key earnings reports for some of its components. It was up 1.15%.1 The S&P 500 retreated -1.55%,2 and the Nasdaq, once again this year, felt the brunt of the downside, dipping -3.11%.3 Fixed income yields rose on the week once again. The yield on the 10-year Treasury hit a 13-year high during the week and finished Friday at 4.01%, up 0.13% from the week prior.4
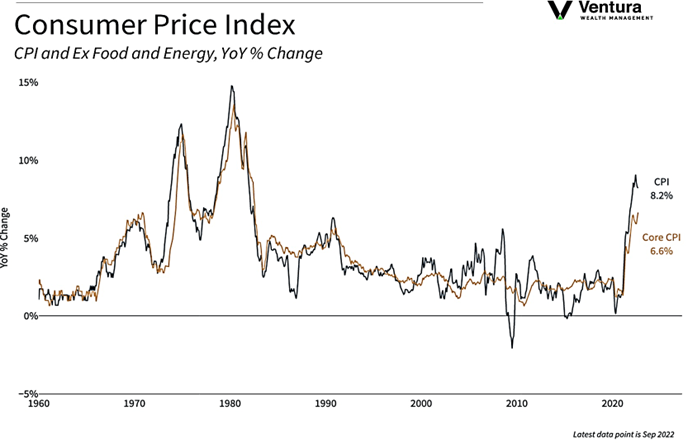
The sizeable price swings last week underscore the dangers of trying to time the market. Market historians will point out that the largest up days in market history typically come in bear markets;5 unexpected rallies can significantly aid performance in choppy seas. Thursday’s CPI report (chart right) once again showed inflation being stickier than any of us would prefer. While there was a glimmer in Federal Reserve commentary hinting that the Fed may be thinking about slowing down hikes6 – the CPI reading likely closed that window. The market is now pricing in the likelihood of two 0.75% hikes between now and year end.7 This week’s economic data will center on industrial production and housing, while earnings’ season is now in full swing.
Chart of the Week
Sources
Market Moving Events:
MarketWatch.com
Chart of the Week:
Clearnomics, Haver,
Bureau of Labor Statistics
Statistic of the Week:
The Washington Post
Global Perspective:
Bloomberg Opinion
Commentary:
1.Bloomberg
2.Bloomberg
3.Bloomberg
4.Bloomberg, Investor’s Business Daily
5. Barron’s
6. Investor’s Business Daily
7. Barron’s